Mercedes-Benz: Successful October due to strong unit sales in China

Mercedes-Benz increased its unit sales by a double-digit growing rate in October, delivering a new high of 173,096 vehicles (+11.5%). In Europe and Asia-Pacific, the Stuttgart-based company with the three-pointed star achieved the highest unit sales ever in an October.
In China, the biggest single market, Mercedes-Benz already surpassed its unit sales of full-year 2015 in October. In addition, the milestone of five million Mercedes-Benz compact cars sold since their launch was passed.
Stuttgart – Mercedes-Benz made a successful start to the fourth quarter: Unit sales increased by 11.5% to 173,096 vehicles in October and 1,711,017 vehicles were handed over to customers in the first ten months of the year (+11.7%).
This means that the Stuttgart-based company with the three-pointed star posted best-ever figures in October and in the first ten months of this year.
Last month, Mercedes-Benz was the market leader among the premium manufacturers in Germany, Italy, Spain, Switzerland, Japan, Taiwan and the USA.
Ola Källenius, Member of the Board of Management of Daimler AG responsible for Mercedes-Benz Cars Marketing & Sales: “Mercedes-Benz made a successful start to the fourth quarter with double-digit growth and the 44th consecutive record month.
And with more than 387,000 vehicles sold in China since the beginning of the year, we have already surpassed the total unit sales of full-year 2015.”
Mercedes-Benz unit sales by region and market
Last month, sales in Europe rose to 71,635 units, an increase of 9.6% and the highest number ever sold in an October. In Germany, the domestic market, approximately 24,000 vehicles with the three-pointed star were delivered to customers.
At the beginning of the fourth quarter, Mercedes-Benz achieved especially strong growth of more than 20% in France, Italy, Belgium and Switzerland.
Sales of 63,771 Mercedes-Benz vehicles in the Asia-Pacific region represent substantial growth of 23.8% compared with the previous best October unit sales achieved last year.
In China, the biggest single market, strong demand for automobiles with the three-pointed star led to sales growth in the period of January to October of 29.3% to 387,015 units. This means that Mercedes-Benz had already surpassed its sales of full-year 2015 by the end of last month.
In the NAFTA region, 32,906 customers received their new car with the star in October. In the USA, Mercedes-Benz sold 28,659 units. In Mexico, demand reached a new high – never before had so many vehicles of Mercedes-Benz been handed over to customers in an October.
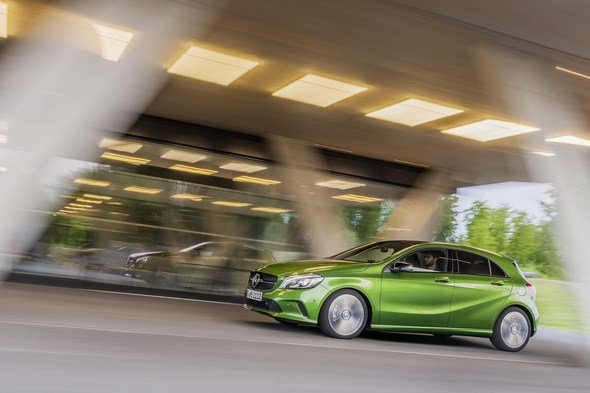
Mercedes-Benz unit sales by model In the first ten months of the year, more than half a million A- or B-Class, CLA, CLA Shooting Brake or GLA models were delivered to customers worldwide (529,127 units, +10.8%).
Demand for those models had never been higher in the period of January to October. The success story of Mercedes-Benz compact cars began with the launch of the A-Class in 1997.
Since then, more than 5 million compact cars have been delivered to customers.
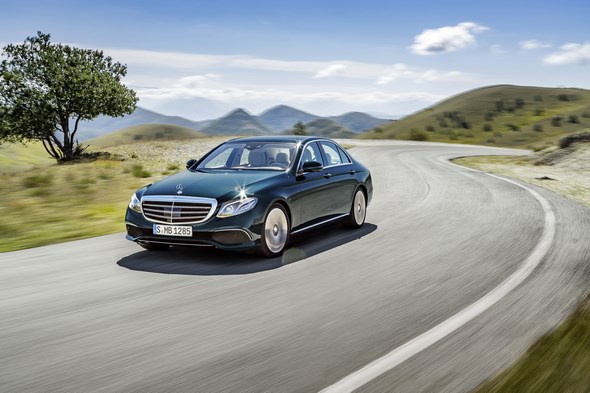
In the year of the E-Class, 25,136 units of the Saloon and Estate were delivered worldwide last month (+34.6%). The new E-Class Estate was successfully launched in Europe, its strongest-selling region, in October.
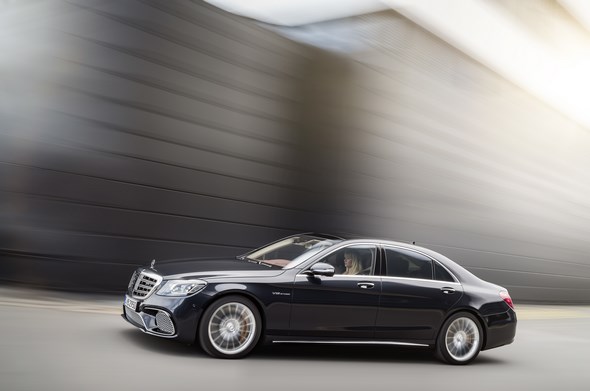
The Mercedes-Benz S-Class Saloon has continued to be the world’s best-selling luxury saloon since the beginning of the year. Demand for the Mercedes-Benz flagship was particularly high in China last month.
smart
The smart brand delivered 11,510 cars to customers worldwide in October (+9.4%). The smart fortwo and forfour were especially popular in China, where unit sales more than doubled to reach a new record in October.
Overview of sales by Mercedes-Benz Cars
October 2016 Change in % Jan.–Oct. 2016 Change in %
Mercedes-Benz 173,096 +11.5 1,711,017 +11.7
smart 11,510 +9.4 117,205 +18.9
Mercedes-Benz Cars 184,606 +11.4 1,828,222 +12.2
Mercedes-Benz unit sales in the region/market
Europe 71,635 +9.6 740,892 +12.4
– thereof Germany 23,972 -1.1 242,441 +7.5
Asia-Pacific 63,771 +23.8 601,526 +20.8
– thereof Japan 4,715 +15.1 54,955 +2.5
– thereof China 42,224 +27.6 387,015 +29.3
NAFTA 32,906 -1.2 323,124 +0.9
– thereof USA 28,659 -1.0 277,863 -0.4


